You’ve connected your ecommerce store with Peel, your data is downloaded and precomputed into hundreds of metrics and reports with dozens of unique tools within the platform…
Phew. Deep breath. There’s a TON to discover in Peel, but it’s best to get started with the basics.
So here’s your guide on how to get started in Peel.
Feel free to hop to any of these sections, but here’s what we’re covering to get you started in the platform:
- Essentials
- Segmentation
- RFM Analysis
- Audiences
- Template Library
- Adding New Users & Admins
- Integrations

First place to look is your Essentials tab!
It’s the collection of your most important metrics that’ll help you understand your business – from crucial retention data like Repurchase Rate by Cohort to super detailed product analytics like Market Basket Analysis and so much more:
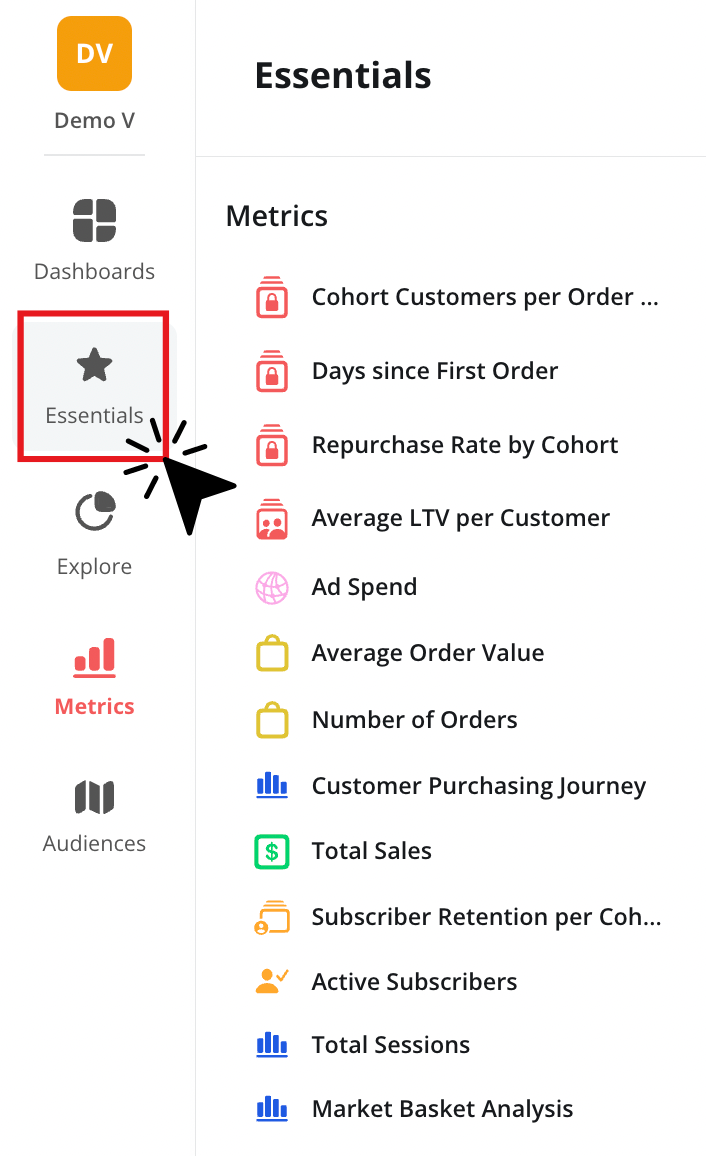
This is the best place to start to get a feel for the metrics that live in Peel and the perfect way to start digging into your product, customer and campaign performance.
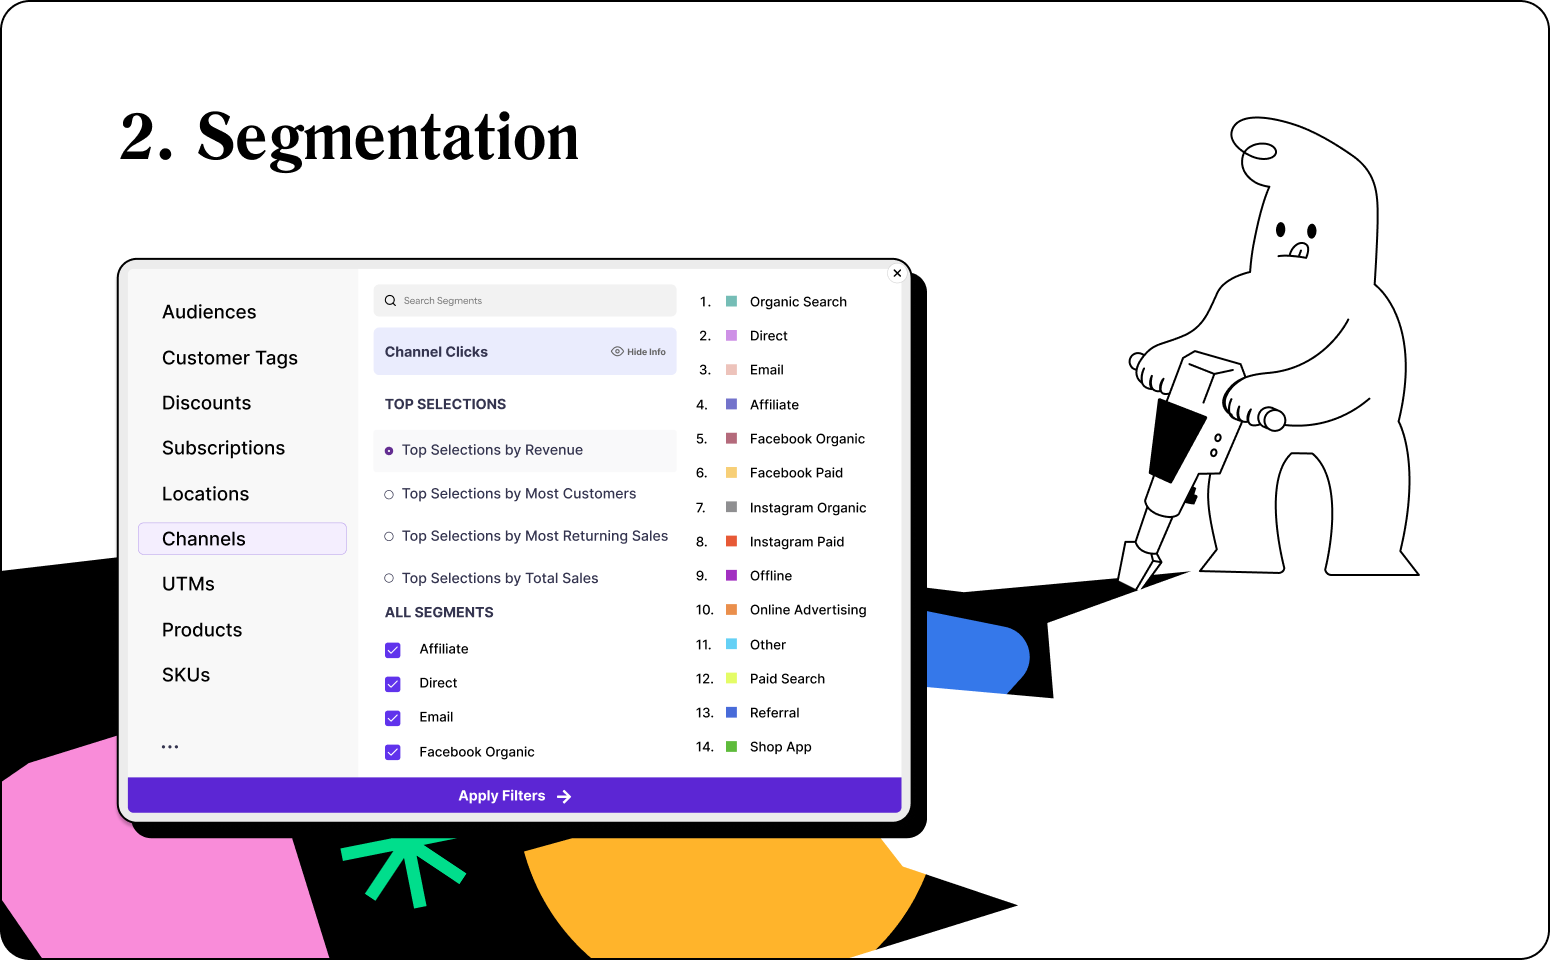
Segmenting helps you zoom in!
Any of the reports you look at in Peel can be segmented to look at specific values like products, SKUs, specific customer tags, channels, and more.
The best part of this process is that it’s super easy. All you do is select the “Segment Analysis” option on any of your metrics.
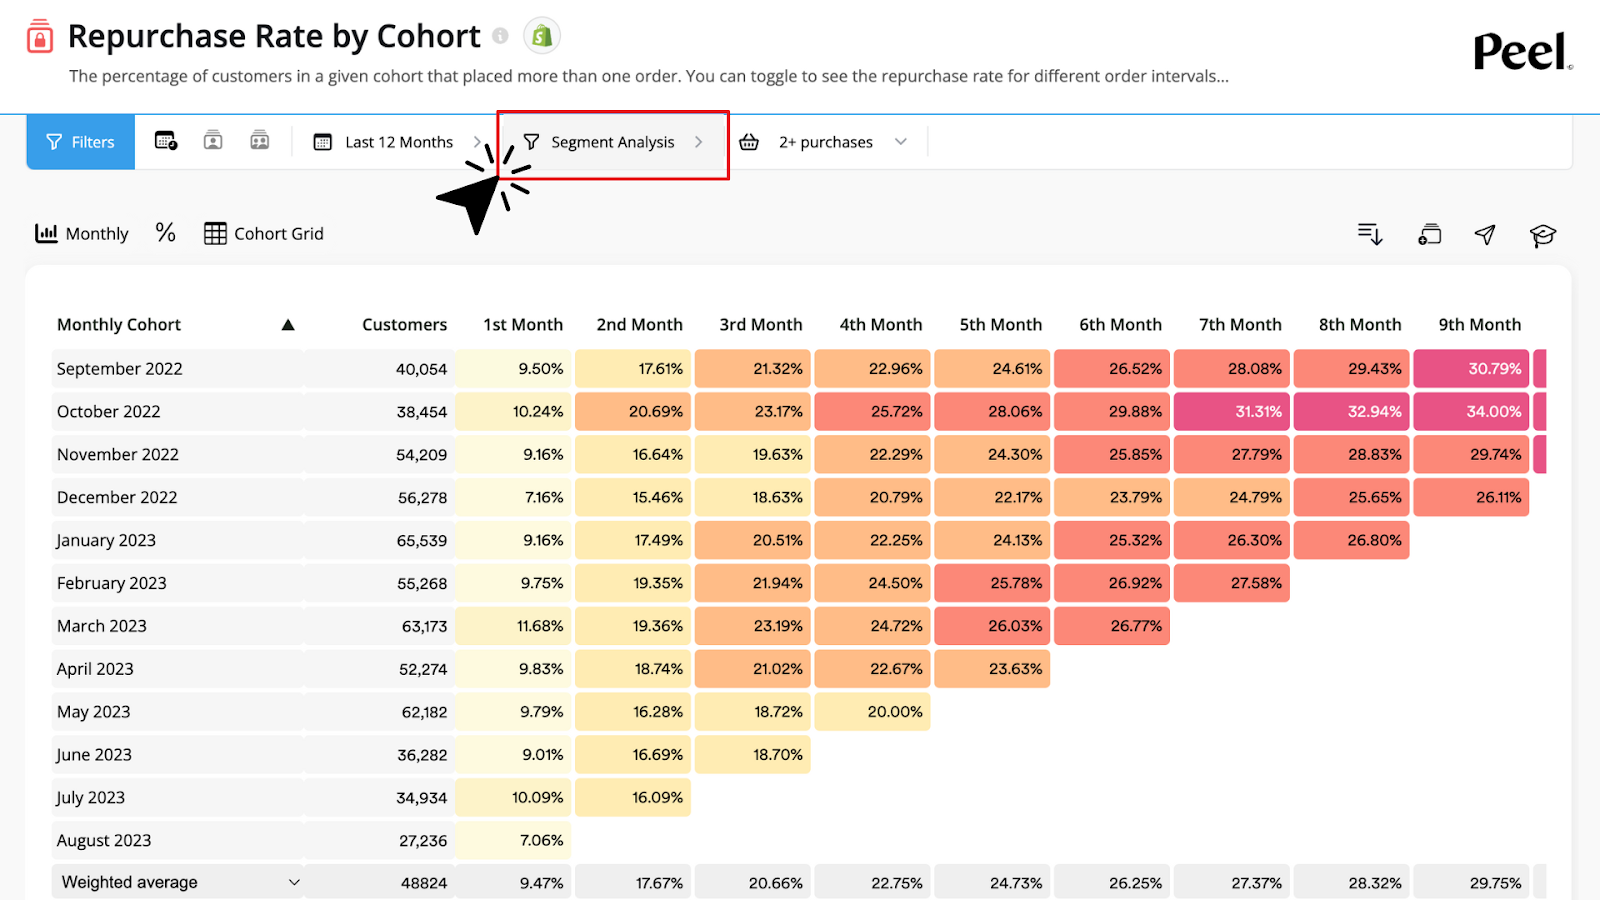
From there, you get a pop up menu with dozens of filters. Choose from values like, products, locations, campaigns, customers, and more. Literally whatever you want to zoom into for the given metric!
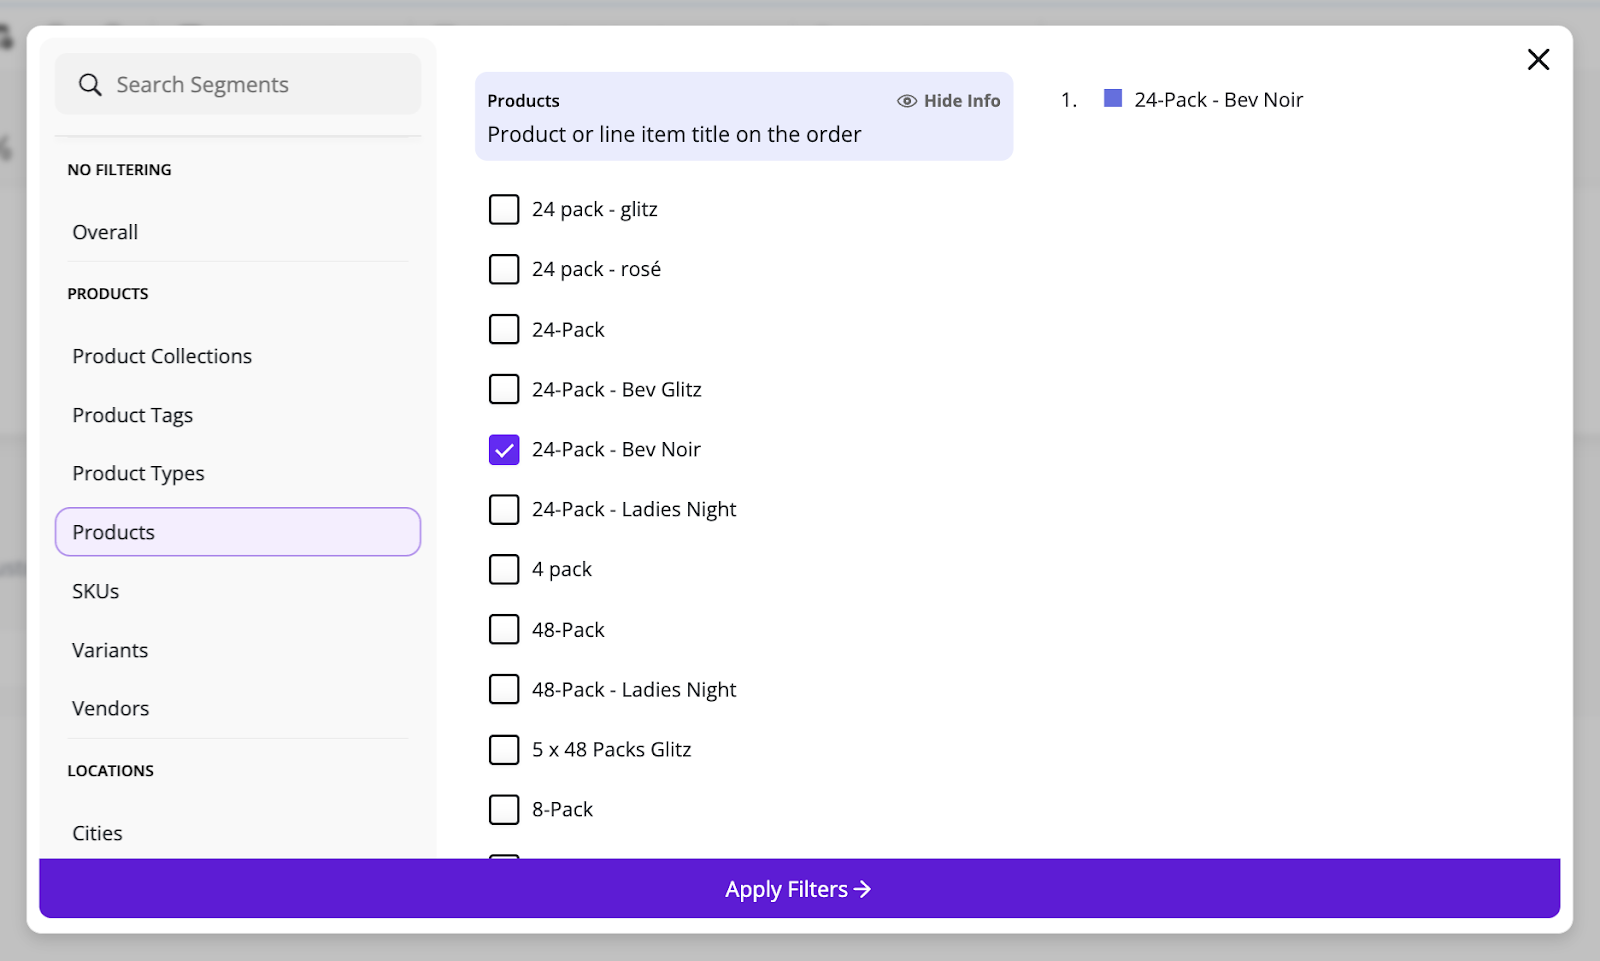
Once you’ve selected the values you want to filter for, just hit “Apply Filters” and you’ll see that graph or table segmented for what you’ve selected.
This is perfect for answering questions like:
- What’s my cohort LTV for customers who bought a specific product?
- How has my most recent discount campaign impacted AOV?
- How’s my Repurchase Rate after 6 months in a specific geo?
And so much more! You’ll get a visual that instantly shows you the data that you’re trying to zoom into. All you have to do is choose your segment filters!
If you want to get a little more strategy on segmentation, you can learn about using customer tags and segments to drive growth here.
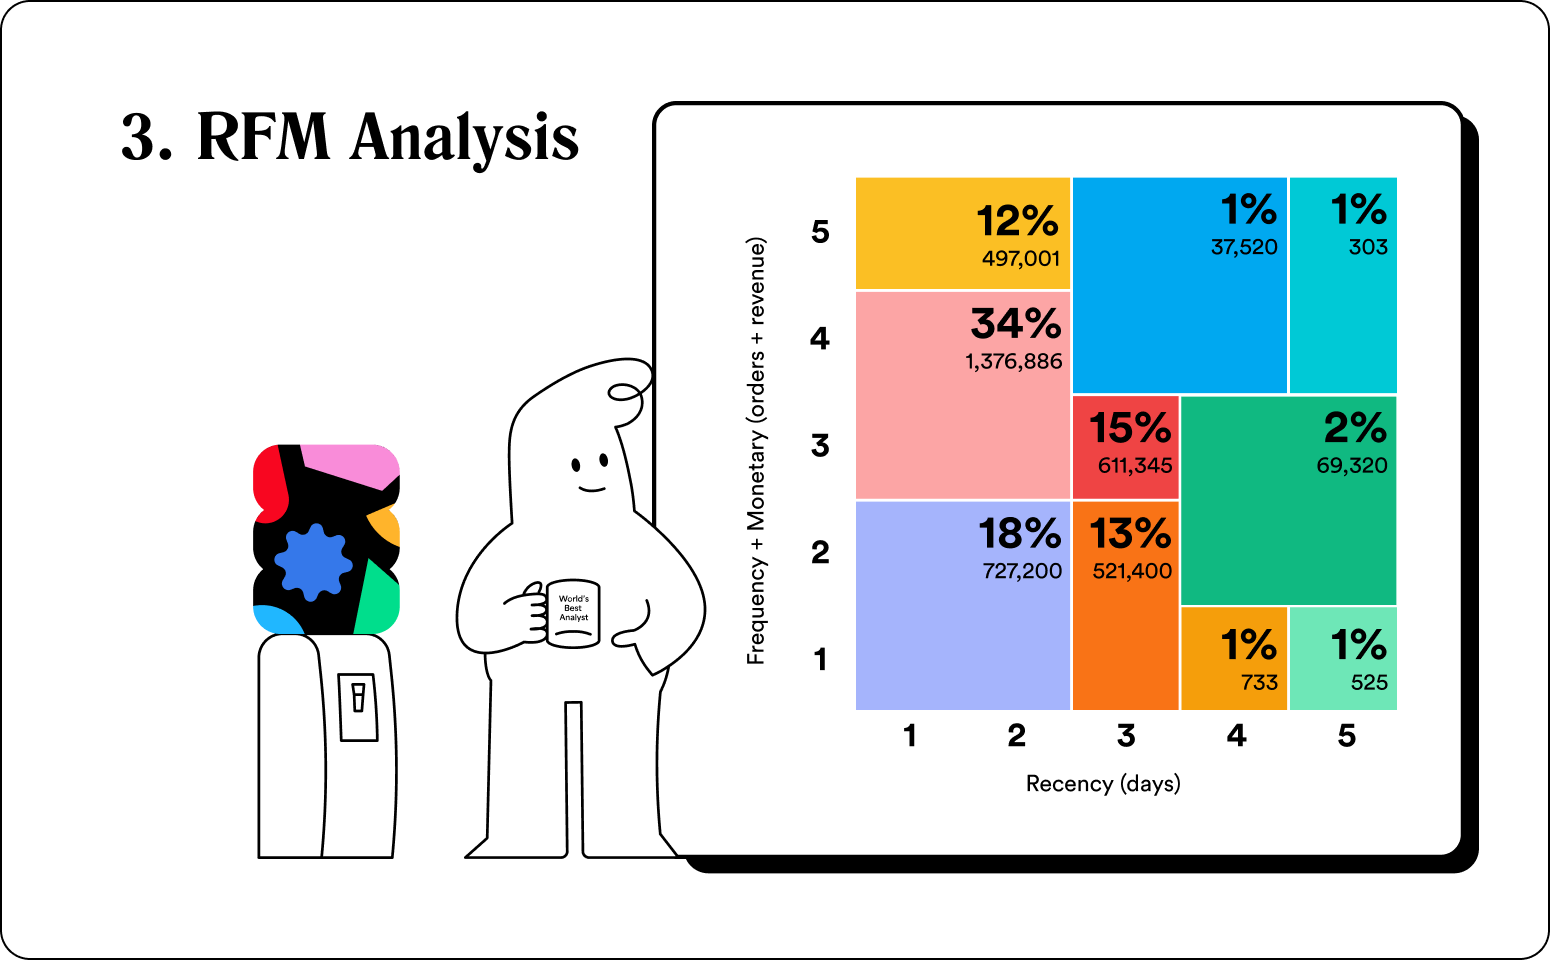
Customer segments done entirely for you!
Now that you know how to build custom segments in your metrics, there’s an even easier way to look at customer segments: RFM Analysis!
RFM Analysis lives on your Peel homepage and gives you a snapshot of 10 automated customer groups that are broken up based on their loyalty levels and recent purchasing habits. Each of those can be turned into an Audience in 1 click!
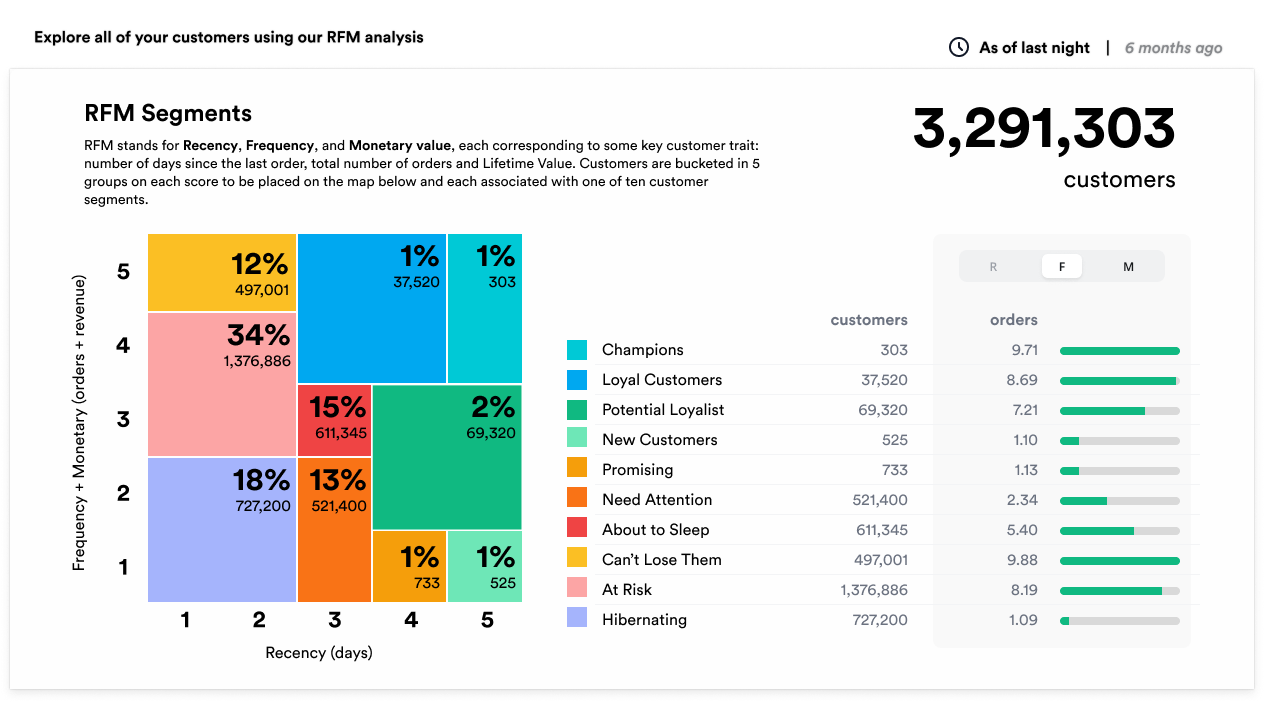
TLDR: It’s out-of-the-box customer segmentation to fuel your personalized marketing campaigns.
Check out our strategy guides on how to use RFM Analysis with examples from some top D2C brands!
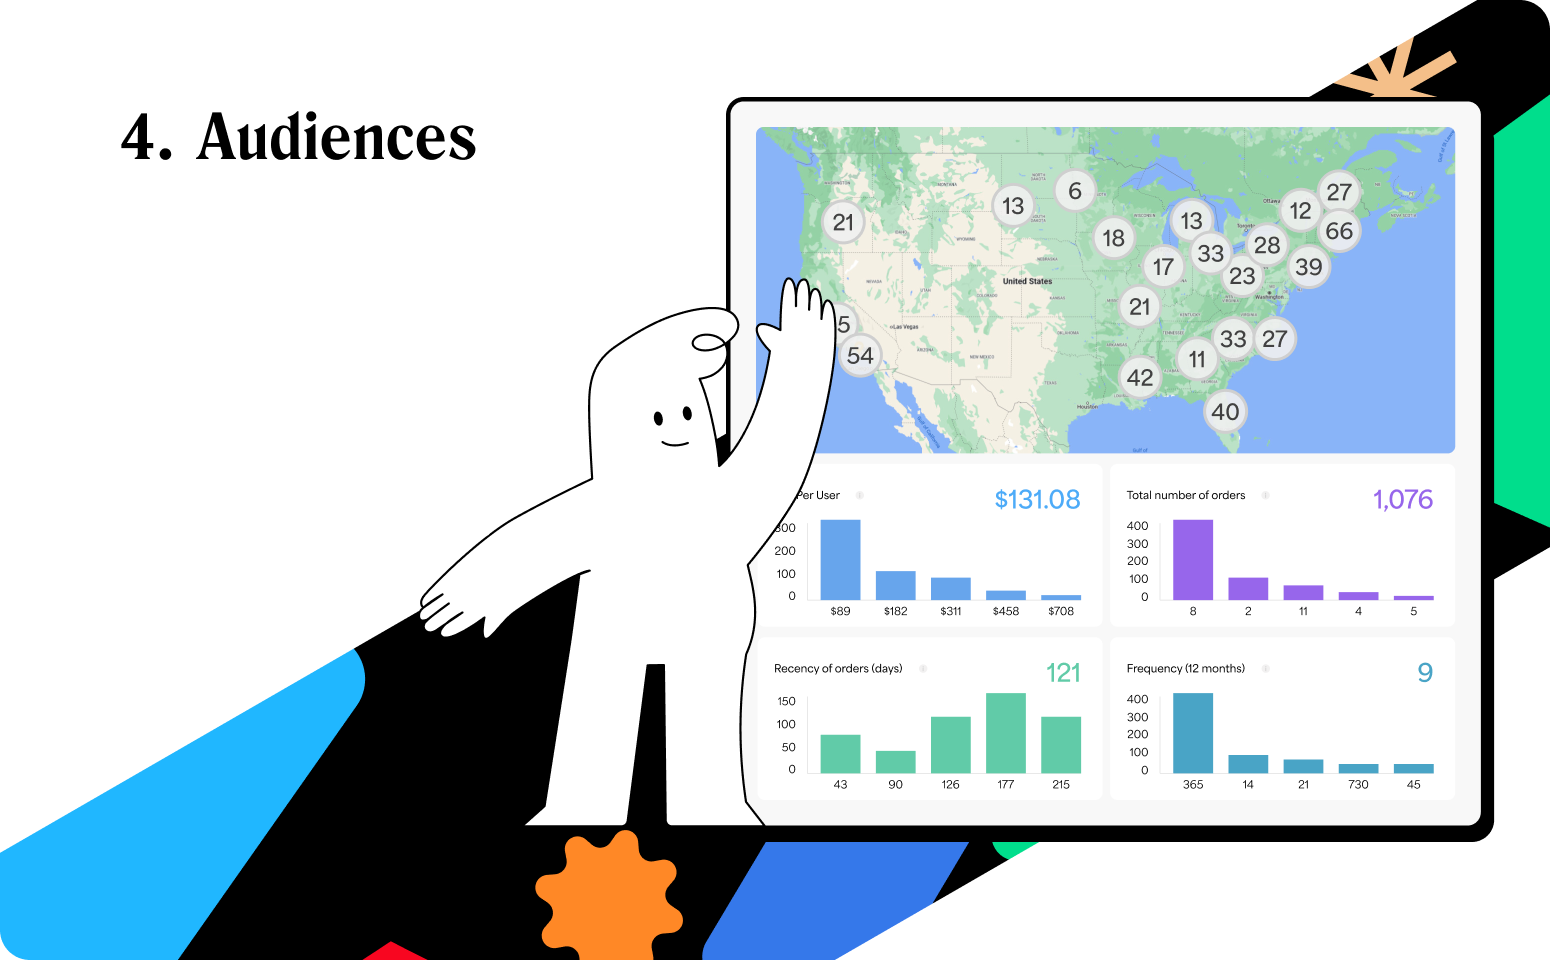
Building customer Audiences just got easier.
If you want to dig deeper and create custom Audiences, all you have to do is choose Audiences on your left menu, and choose from dozens of filters to find the exact pocket of customers you want to closely monitor.
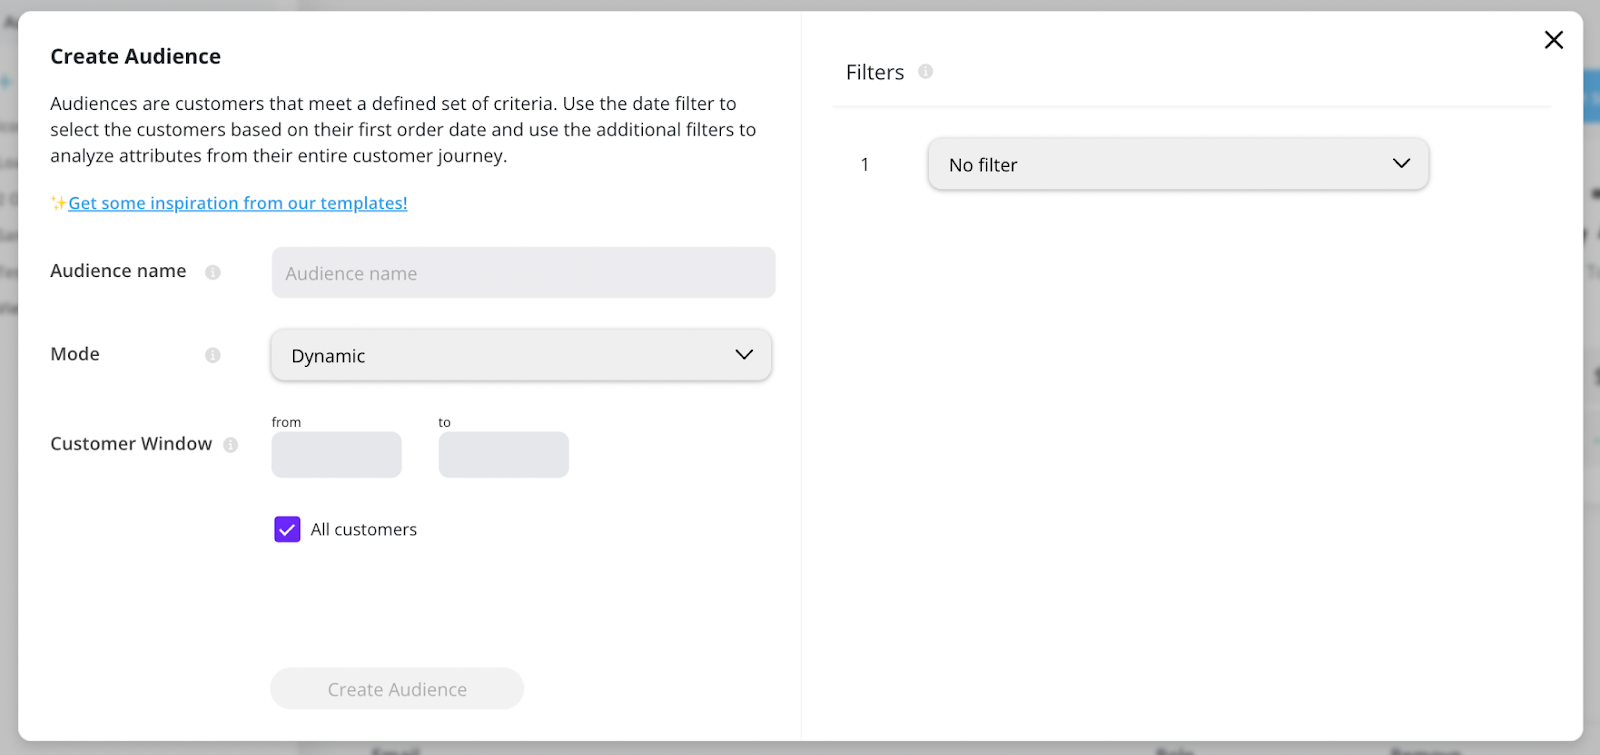
Filters include any of the dimensions from your data, including product-specific data, customer info, locations, and more.
After you select your filters and choose “Create Audience” your view will look like this:

Your Audiences view allows you to track that group’s growth over time AND lets you push that group as a list to Klaviyo or FB for retargeting campaigns.
All you have to do is click “Send” in the upper right corner of your Audience and you can choose which platform you’d like to push to!
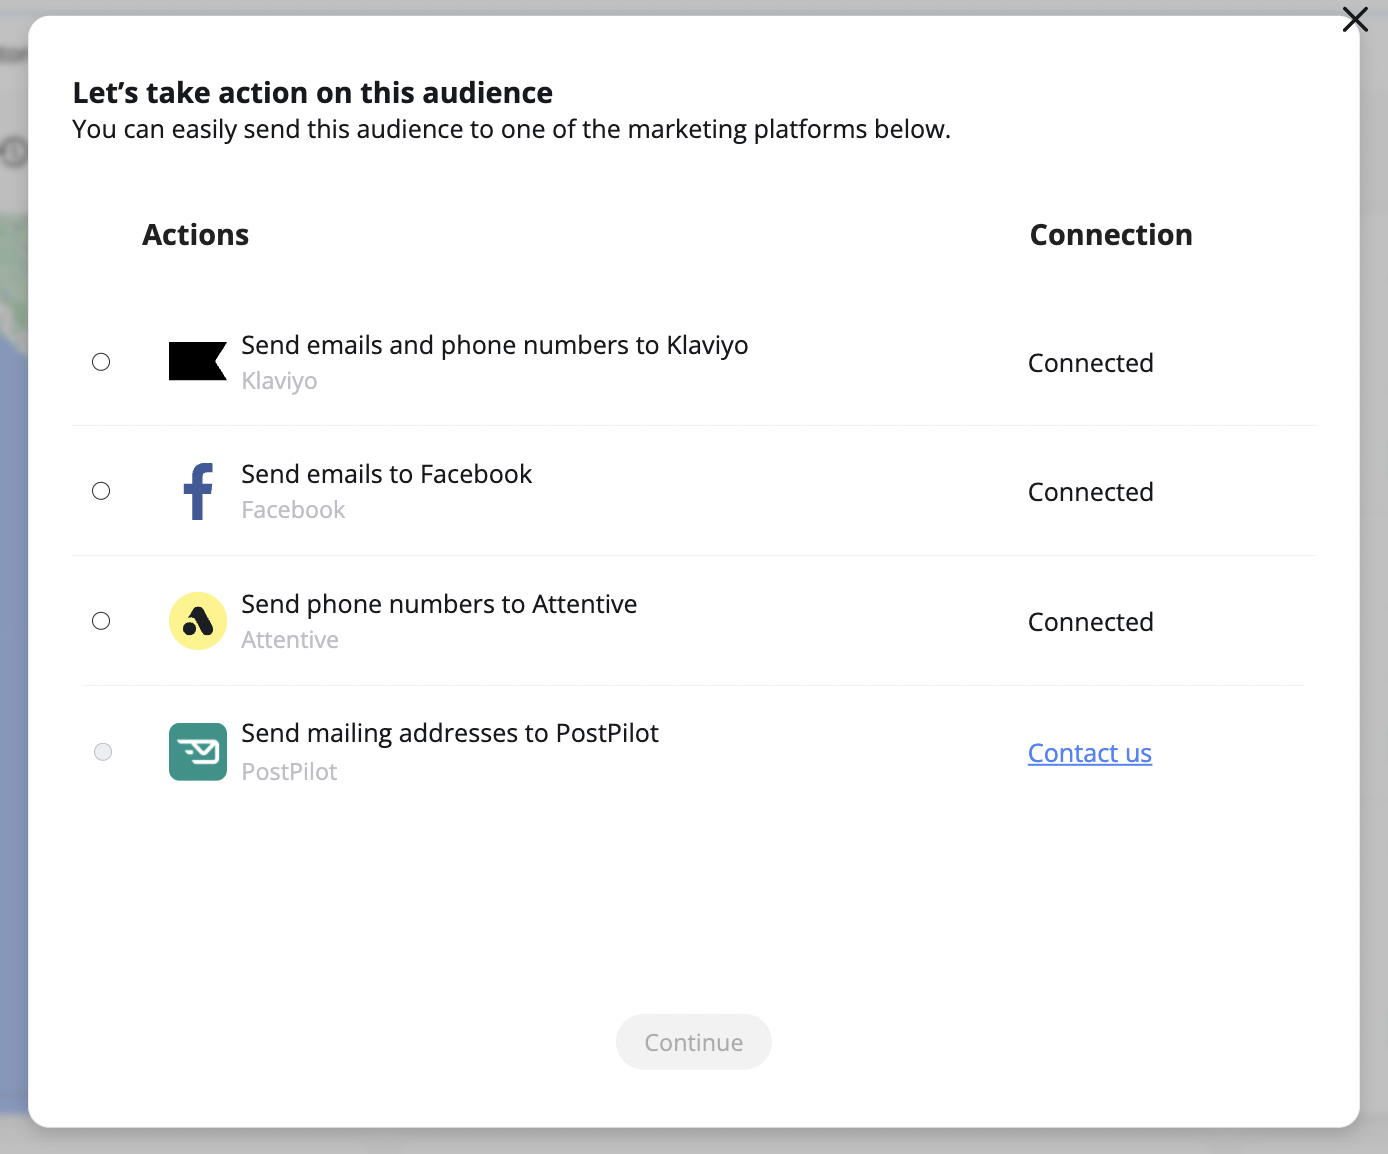
Here’s a full article on Audiences if you want to go a little deeper!

Easy-to-use Dashboard templates & more.
The templates library is where you’ll find pre-made Dashboards, Slices (special reports with multiple dimensions analyzed) & Audiences.
It’s incredibly easy to use; just choose the template that you want to add to your Peel account and click to add it. Literally one click!
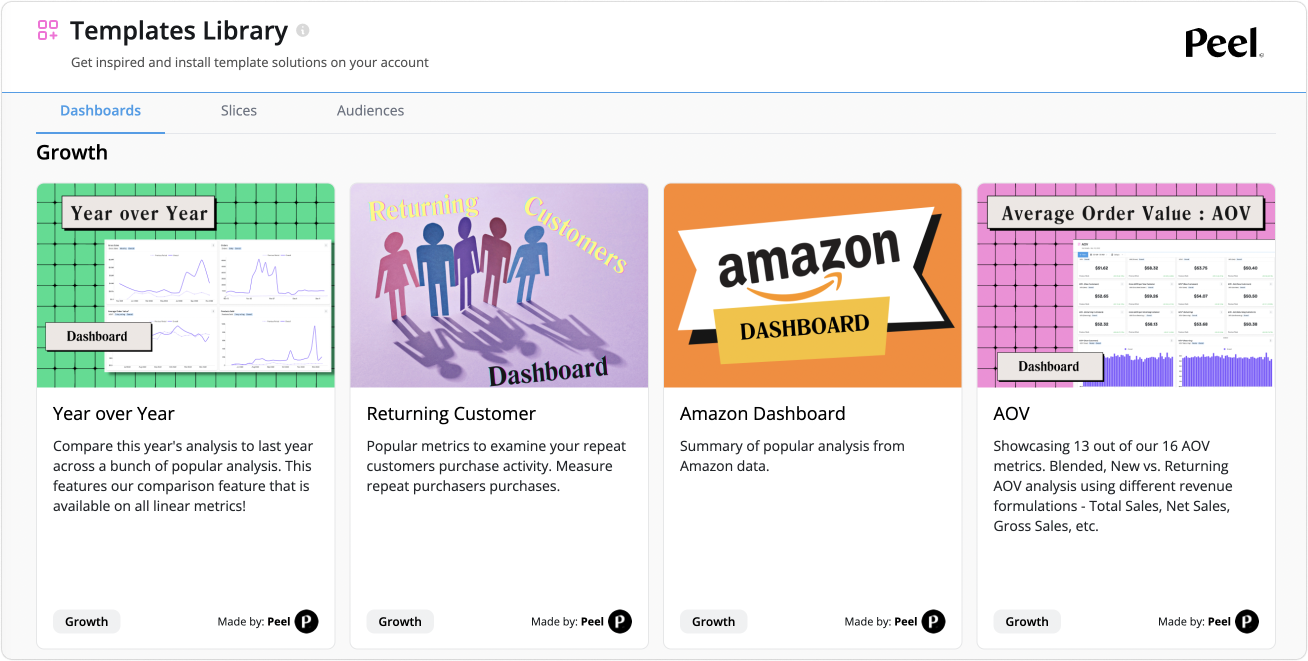
You’ll find pre-made dashboards that focus on specific types of customers and channels. Slices that dig deeper into the nitty gritty of your data. And unique Audiences that are the perfect fuel for launching your next Klaviyo or FB campaign.
We’re constantly adding new content to the Templates Library!
Data is more fun with friends!
Adding your teammates to Peel is SUPER easy. And it’s the fastest way to get all your key users up and running.
- Click on Pal’s face on the bottom of your left menu
- Choose “Billing and Account Settings”

- Scroll to the “Invite a new user” section
- Type in your colleague’s email and hit send!

Voila! It’s that easy to invite your teammates!

Let’s connect your tech stack!
The more data sources you have connected to Peel, the more you can get a full picture of your store performance!
Here’s how you access and add all the important integrations from your tech stack:
- Click on Pal’s face on the bottom of your left menu
- Choose “Connections and Datasets”
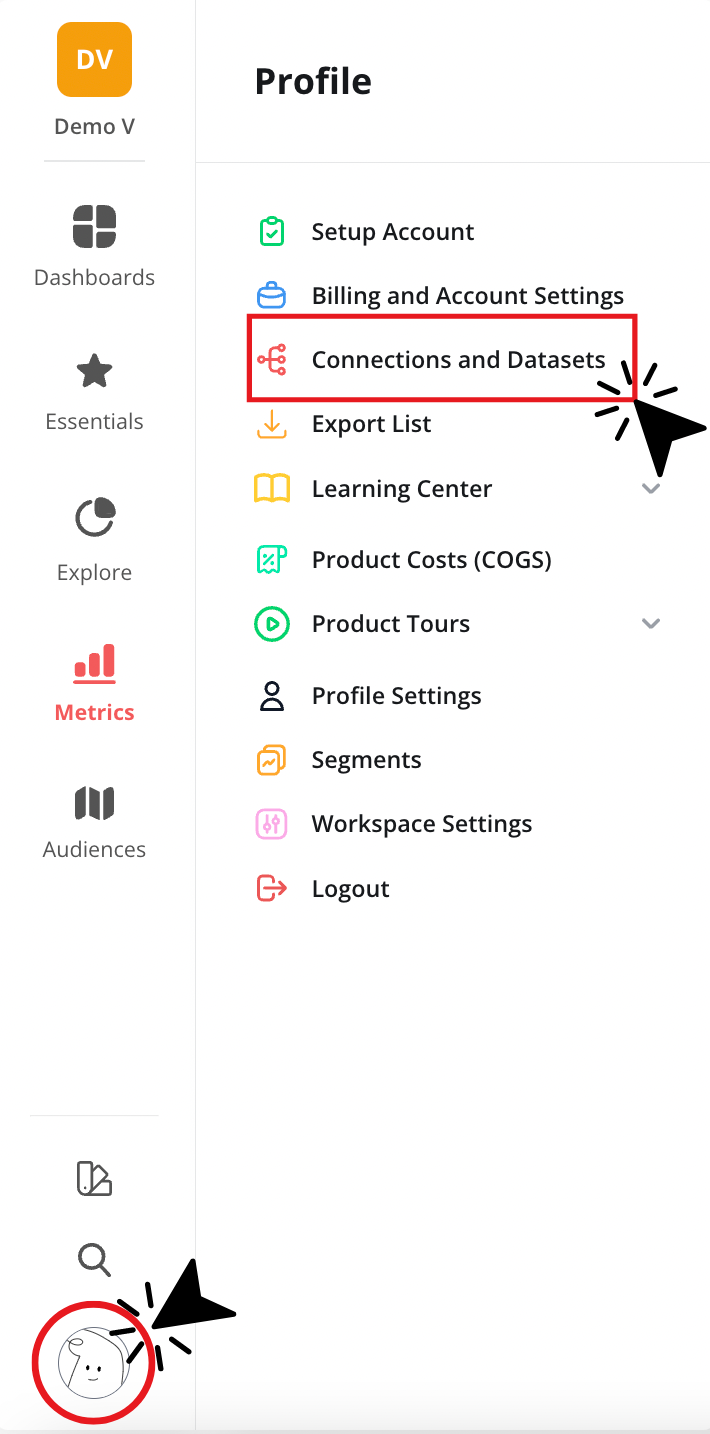
- Choose “Add Datasource”
- Choose the datasources you’d like to add and follow the on-screen prompts to complete the connections.
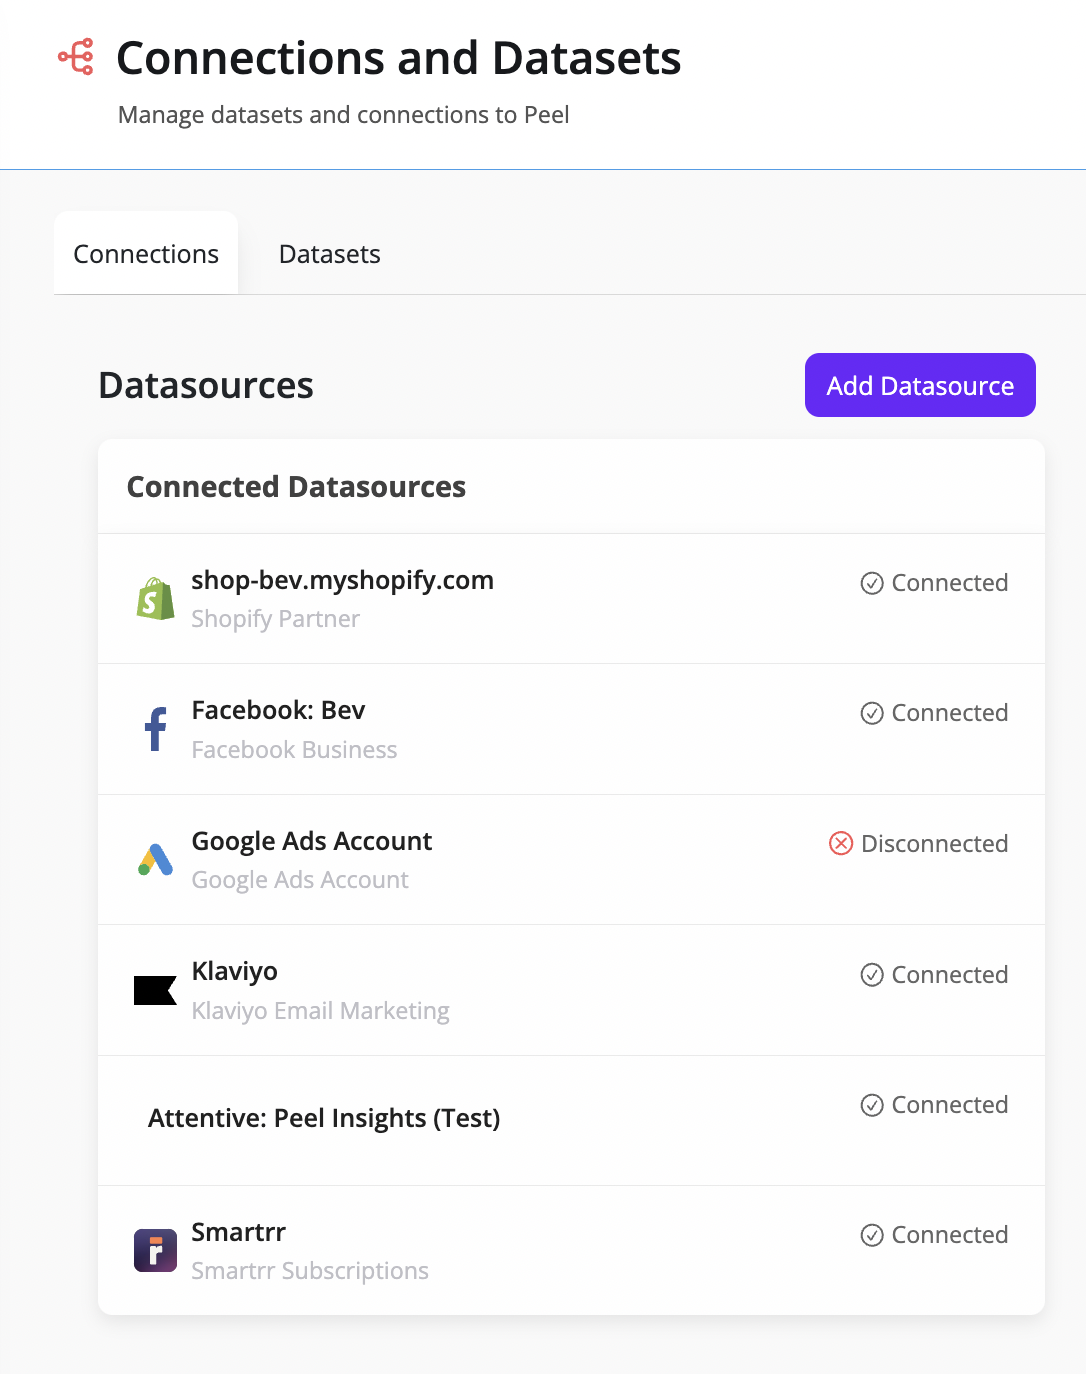
In this view, you’ll be able to see all of your connections along with the status of them. It’s an easy way to manage your data sources.
*Note: The more you connect, the fuller your insights and analysis will be for every angle of your business.
Check out the full list of integrations which is always growing!
You're all set to get Peel-ing!
That’s a wrap for getting started in Peel. If you want to explore more information on features within Peel, feel free to browse the blog, check out our Youtube channel, or read through our documentation.
If you have any questions that go beyond that info, our Customer Success team is always on hand to help. Don’t hesitate to reach out!


.webp)


.avif)


.png)


.svg)
.svg)